


Graphs: can’t live with ‘em, can’t live without ‘em… The headphone community has come to rely on Frequency Response Graphs to get a visual representation of what a headphone might sound like, and to those with some experience, a good graph made on a known test setup can reveal a fair amount of information. Since graphs are open to interpretation, not all details are represented and a lot can be lost as well.
At Audeze, we primarily use FR graphs to see if there are any issues that need addressing, such as jagged response, break-ups, or unwanted peaks or valleys. FR graphs don’t tell us anything about transient response, phase response, transparency, or detail retrieval. As such they’re not a substitute for active, informed listening or common-sense judgement. Measurements on test equipment can only reveal so much, and there are limitations to what any gear can measure accurately. The best test gear in the world is actually right between your earlobes!
On top of this, everyone's ears and head interact with headphones very differently, so what one person hears from a given pair of cans will most likely be quite different from what another person hears (to say nothing of what a test microphone hears!).
Imagine looking at a picture of a flower in order to determine what that flower might smell like. If you have some experience with flowers, that would be reasonable (most people can imagine the smell of a rose by looking at a picture of one), but what if you see a picture of a jasmine or gardenia flower? Until you gain enough experience to know the differences, these images won’t have the proper meaning or context to let you make any educated judgements about those flowers’ fragrances.


To push this metaphor even further, what if you saw one picture of a flower that was taken by a pro photographer with a high quality camera, and another on the screen of Grandma’s 2001 flip-phone? If you had enough experience with flowers, the pro-shot photo would most likely tell you all you needed to know to identify that flower so you could know what it might smell like. On the other hand, if you’re lucky you might be able to tell if Grandma’s photo was amorphophallus konjac rather than amorphophallus titanium, which would be a completely different olfactory experience!
All this is just an amusing way to say that graphs are only as good as the equipment they were made with, and are dependent on the interpretation and experience of both the graph’s creator and its viewer. If the graph’s creator isn’t very experienced at measuring headphones, and/or the viewer of the graph doesn’t know much about the measurement equipment and hasn’t heard enough headphones to compare with other graphs, the data isn’t very helpful -- and can actually be downright misleading, too.
Since the beginning at Audeze, we’ve provided individual FR graphs for most LCD headphones, and we continue to provide them by request for our upper-end models (above LCD-2). The key thing to remember about these graphs is that they’re very consistent since they’re all made with the same high-quality test equipment by an experienced technician. For you fellow nerds keeping track, we use Neumann KU100 and G.R.A.S. KEMAR binaural mic heads, and Clio and Audio Precision measuring rigs, and each of these systems produces different results. Our engineers have over a century of combined experience with these measuring systems, so they know what to look for in a graph-- but they have to know which system did the measuring to interpret the graph properly.
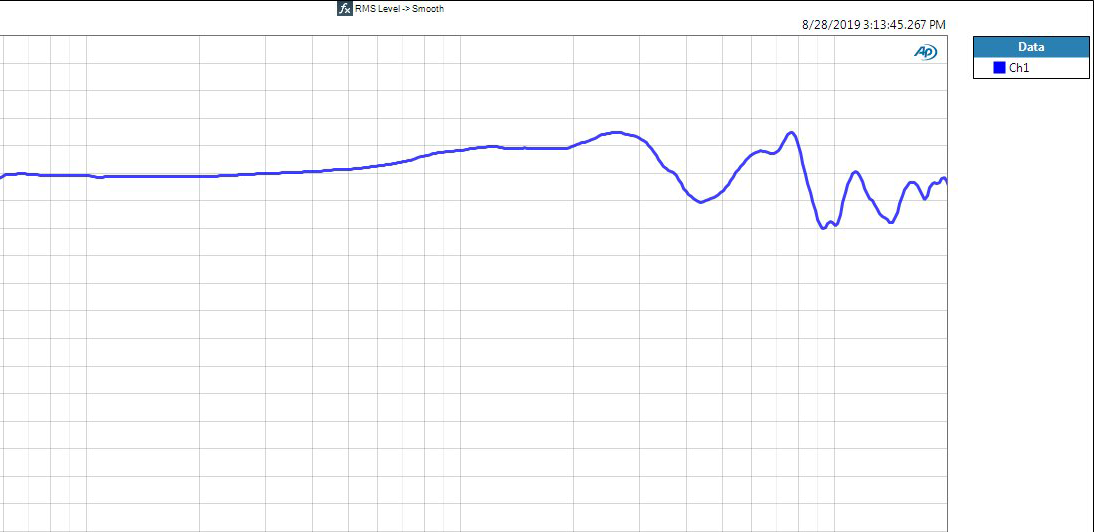
Below we have two graphs showing an EQ curve for the same pair of LCD-4z headphones, as measured on our Neumann and G.R.A.S. test systems. To an uneducated eye, these might appear to be graphs of completely different headphones, but to our experienced engineers, it’s clear they’re the same cans. This apparent difference has everything to do with the fact that each system measures differently and has different resonances and/or compensations.


Also since the beginning, we’ve created our headphones with a “target graph” as a goal, which is a visual representation of what many have described as the Audeze House Sound, and is loosely based on what's known as the Fletcher-Munson and Harman curves. Our engineers feel that headphones with graphs like this target graph tend to offer a similar experience to listening to high-quality speakers in a well-treated room. This is one of the reasons our headphones are famous among mix- and mastering- engineers for having excellent translation, and partly why they’ve become such a trusted tool in the recording arts.
Recently, some companies have launched software that can apply EQ compensation to create a theoretically “perfect” frequency response in a given pair of headphones. In theory, we applaud an attempt to achieve the most neutral frequency response possible, but we advise some caution regarding how much aftermarket compensation is applied, since that can introduce distortions, skewed phase response, and filter anomalies. Though some people may think a completely flat FR curve is desirable, the truth is that a flat response curve will sound very wrong with headphones. The human hearing mechanism has built-in resonances that must be taken into account, and measuring headphones is not the same as measuring speakers in a room (where a flat response is often desirable). A good headphone measurement rig will mimic these natural resonances, and the graphs produced by it will show this.
Though companies that offer to create a custom compensation curve for your model or particular pair of headphones certainly have their place in the market, with all due respect, we find minimal correlation between their test results and our own. More importantly, we've found that some of their "compensations" can actually diminish what's special about our headphones, and that reduces their value as a tool. Our tests and measurements have proven that our own target curve translates best to speakers in the real world, and that's why so many professionals have come to rely on the LCD series, particularly the LCD-X. Professionals tell us they choose the LCD-X not just for the accurate response, but also for how well it translates to speakers. Changing the response with a third party app will likely defeat our headphones’ ability to translate so well.
Still searching for the ultimate in accuracy? Don’t despair! Our DSP team created a free DAW plugin called Reveal that's designed to give a similar “target response” for all of our headphone models. This enables customers who have other Audeze models to get a similarly neutral listening effect for even better translation across our headphone lines. The Audeze Reveal plugin is available for download here. If you’re a Roon user, we’ve also integrated those same profiles into Roon’s DSP engine and they’re offered at no additional cost within the Roon platform.
To come full circle back to our flower metaphor: anyone can draw, paint or photograph a flower, and everyone will have their own way of representing and interpreting that flower’s image. This is part of what makes the world of visual art so wonderful, and the same can be said of the audio arts. At Audeze, we’ve always had a very clear vision of what we want our flowers to look like, and we hope this conveys across all the senses and helps you reach the pinnacle of Uncompromised Audio.